Debugging Microsoft Teams Apps: A Practical Guide
You’ve built a Microsoft Teams app.
It installs fine, loads correctly — and yet something behaves not quite as expected.
Welcome to debugging Teams apps.
Because Teams apps are essentially web applications running inside a host (Teams), debugging them is mostly web debugging — with a few Teams-specific twists. This article walks through a practical approach, from the easiest options to the most powerful (and least documented) ones.
Start Simple: Debugging in Teams Web
The easiest way to debug a Teams app is by using Teams in the browser.
Why?
- You get direct access to standard browser developer tools
- Console logs, network requests, and DOM inspection work exactly as expected
- You can attach your debugger directly to your own web application
For many issues — especially UI problems, authentication flows, or API calls — this is often all you need.
When the Issue Only Happens in the Desktop App
Unfortunately, not all problems reproduce in Teams Web.
Some issues only appear in the Windows desktop client, for example:
- Differences in authentication behavior
- Embedded browser quirks
- Desktop-specific Teams APIs
- Caching or storage behavior
In these cases, browser dev tools alone won’t get you very far.
So what are your options?
Option 1: Enable the Teams Public Preview
If Public Preview is enabled for your account, Teams exposes additional debugging options.
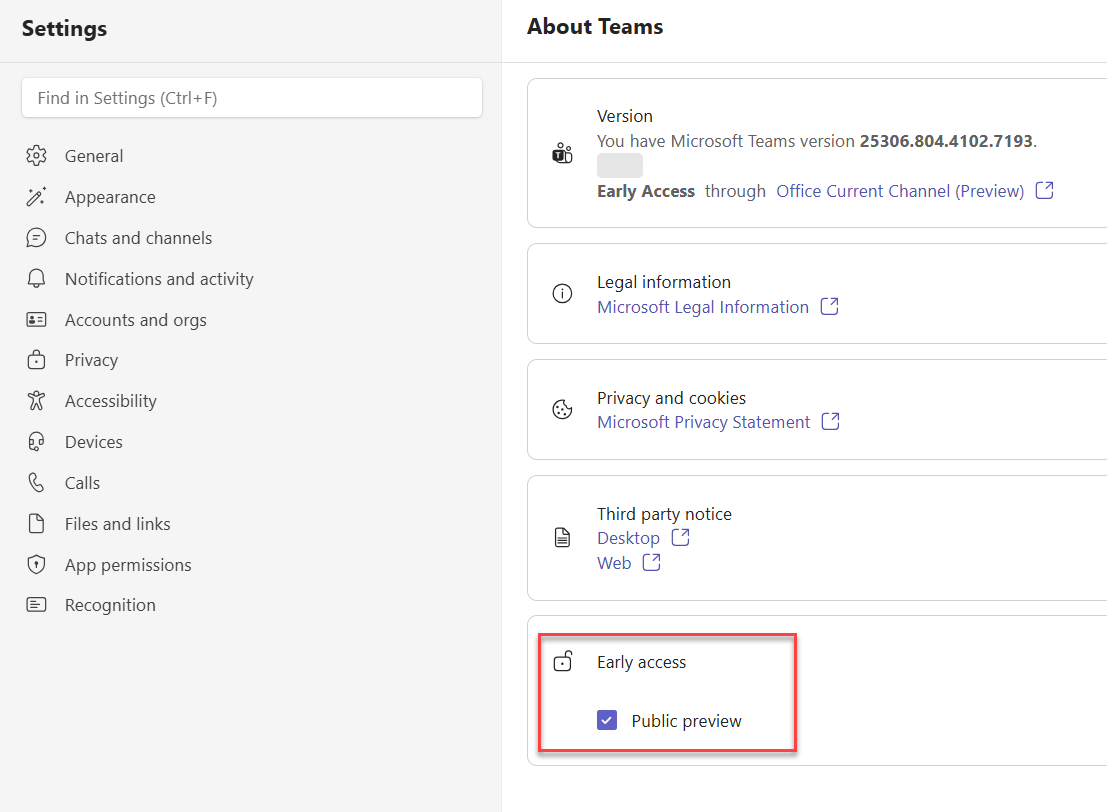
To turn on the Public Preview go to Settings -> About Teams:

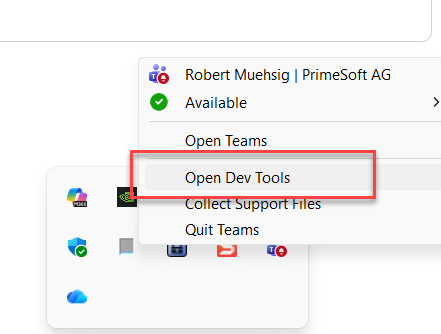
After that a new item in the tray menu appears:

Pros:
- Access to a built-in debug menu
- Easier inspection of app behavior inside Teams
Cons:
- Public Preview may not be allowed in many organizations
- It can introduce unrelated UI or behavior changes
- Not ideal for production-like debugging
Because of these trade-offs, Public Preview is not always a viable solution — especially in enterprise environments.
Option 2: Enable Engineering Tools (Most Powerful)
If you need full insight into what the Teams client is doing, this is the most powerful (and least advertised) option.
By enabling the internal Engineering Tools, you get access to advanced debugging capabilities directly in the desktop client.
I discovered this method in an MS Support forum — so it’s somewhat documented :-).
How to Enable Engineering Tools in the Teams Client (Windows)
- Navigate to the following folder:
%localappdata%\Packages\MSTeams_8wekyb3d8bbwe\LocalCache\Microsoft\MSTeams(Yes - the path is weird, but it’s real) - Create a file named
configuration.json - Add the following content:
{
  "core/devMenuEnabled": true
}
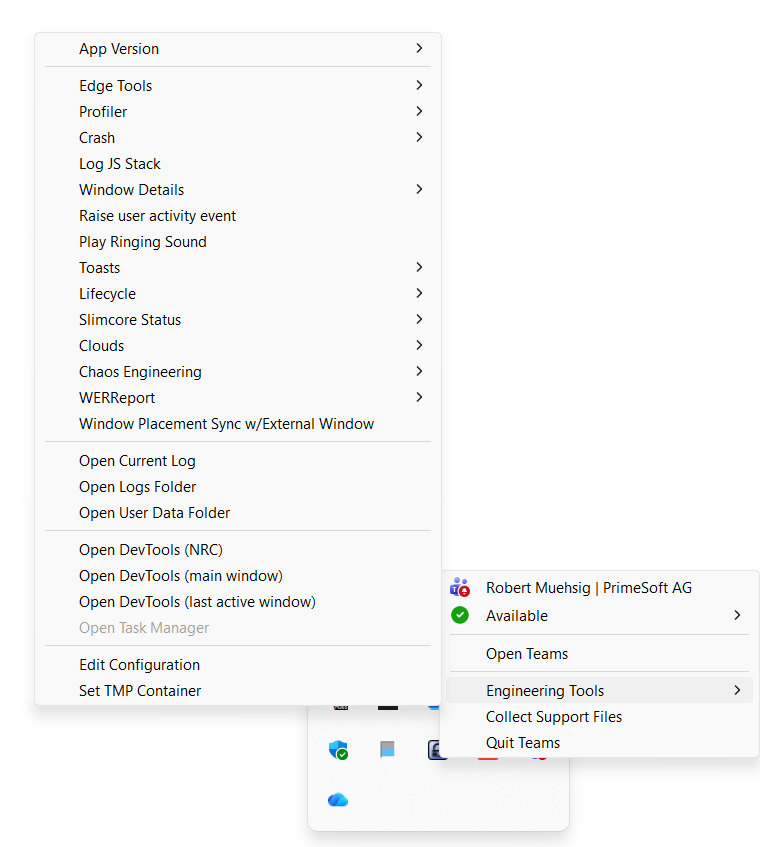
After this restart Microsoft Teams and right-click the Teams icon in the system tray and you should see “Engineering Tools”.

This menu offers much more options (and is probably used for the MS Teams Development and Support Teams). For my needs the “Open Dev Tools” was “good enough”.
Be aware: Some options might be dangerous. It’s called “Engineering Tools” for a reason. Use at your own risk.
Summary
Debugging Teams apps mostly relies on familiar web development tools. The challenge is finding the right way to activate them inside the Teams environment.
Hope this helps!