 .
.
The last hope: Windows Error Reports
The “Windows Error Report” (WER) is automatically generated by Windows and can be seen in the Eventlog. In most cases, you might see some other - debugging friendlier - event logs. If there is a event log from with the source “.NET Runtime”, then use this first. Windows Error Reports are at first a bit strange to read.
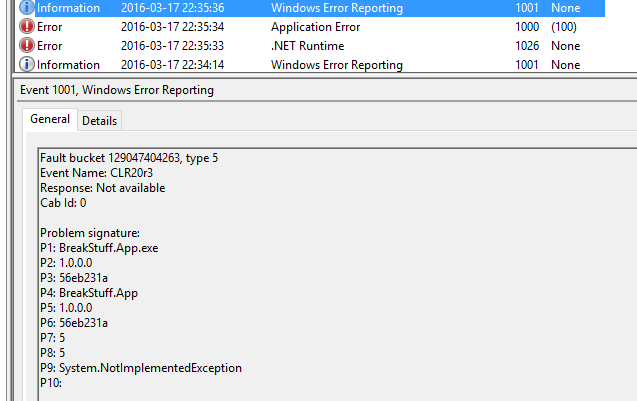
Small, but important hint: I strongly recommend that you should use some logging libraries inside your application as well.
If you still don’t have a clue where your application breaks or those other event logs are missing the WER can be used to see where the exception is thrown in your .NET application.
Windows Error Report for .NET Apps
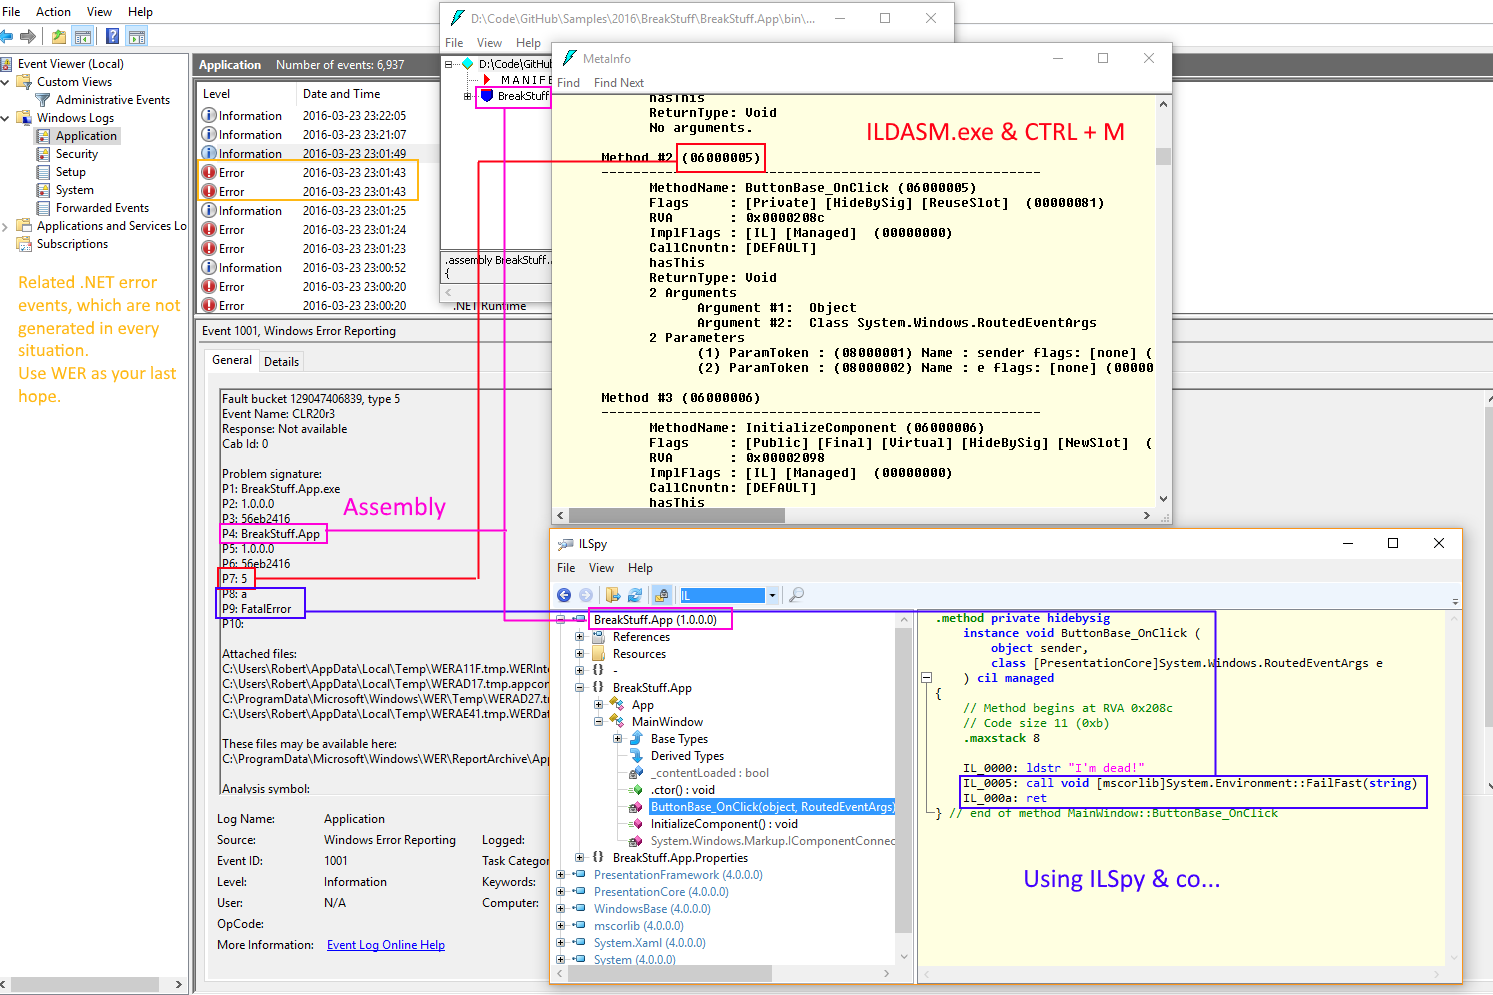
A typical Windows Error Report could look like this:
Fault bucket 129047406839, type 5
Event Name: CLR20r3
Response: Not available
Cab Id: 0

Problem signature:
P1: BreakStuff.App.exe
P2: 1.0.0.0
P3: 56eb2416
P4: BreakStuff.App
P5: 1.0.0.0
P6: 56eb2416
P7: 5
P8: a
P9: FatalError
P10:

Attached files:
C:\Users\Robert\AppData\Local\Temp\WERE708.tmp.WERInternalMetadata.xml
C:\Users\Robert\AppData\Local\Temp\WERF4B5.tmp.appcompat.txt
C:\ProgramData\Microsoft\Windows\WER\Temp\WERF4D5.tmp.dmp
C:\Users\Robert\AppData\Local\Temp\WERF65D.tmp.WERDataCollectionFailure.txt
C:\ProgramData\Microsoft\Windows\WER\ReportQueue\AppCrash_BreakStuff.App.e_1952fbbdf8ecceaa6e9af5c44339210849f4774_b2bbc455_cab_7634f669\memory.hdmp
WERGenerationLog.txt
Each P holds some exception location information:
P1: “BreakStuff.App.exe” = App name or host process e.g. your.exe or Outlook.exe for a .NET addin.
P2: “1.0.0.0” = Version of the executabe
P3: “56eb2416” = Timestamp of the executable
P4: “BreakStuff.App” = Faulting assembly and module name
P5: “1.0.0.0” = Version of the faulting module
P6: “56eb2416” = Timestamp of the faulting module
P7: “5” = MethodDef – MethodDef token for the faulting method, after stripping off the high byte. This is the faulting method in your code. Super important!
P8: “a” = IL offset - in hex, in combination with P7 will it show you the exact position of the exception in your method.
P9: “FatalError” = Exception type
P1-P3 should be easy to understand and nothing new to you. If you have a bigger application P4 might lead to the correct namespace/assembly.
Most important to find the real source is P7 & P8 - I will show you how to read it.
P7: Finding the MethodDef token with ILDASM.exe
P7 tells you in which method the exception occurred. The number shown in P7 is the method token, which is the IL representation of your actual method in code. To see the real method name we need a tool.
As far as I know you could try to use WinDbg, but I was too stupid to use it correctly - ildasm.exe does also work for our use case. To get the method token you need “ildasm.exe”, which is included in the .NET SDK, which is part of the Windows SDK.
On a Windows 10 machine, with the SDK installed, you can use this version:
C:\Program Files (x86)\Microsoft SDKs\Windows\v10.0A\bin\NETFX 4.6 Tools\ildasm.exe
For ILDASM it is not important if the actual .NET app is using .NET 4.6 or any other version.
“ildasm.exe” itself is not a beauty, but works. Now open your assembly from P4 with this tool.
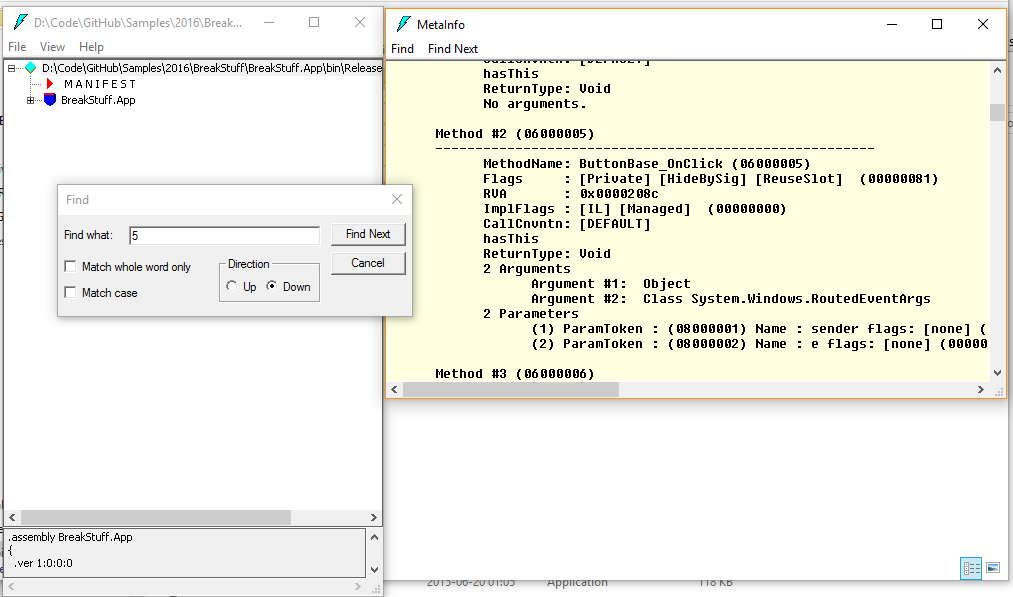
To see the tokens, press CTRL + M and search for P7.
In my case I see this:
Method #2 (06000005)
-------------------------------------------------------
	MethodName: ButtonBase_OnClick (06000005)
	Flags     : [Private] [HideBySig] [ReuseSlot]  (00000081)
	RVA       : 0x0000208c
	ImplFlags : [IL] [Managed]  (00000000)
	CallCnvntn: [DEFAULT]
	hasThis
	ReturnType: Void
	2 Arguments
		Argument #1:  Object
		Argument #2:  Class System.Windows.RoutedEventArgs
	2 Parameters
		(1) ParamToken : (08000001) Name : sender flags: [none] (00000000)
		(2) ParamToken : (08000002) Name : e flags: [none] (00000000)
Take a look at the method description: 0600000 5 - the 0600000 is the high byte (whatever that means… - just search for the number, I bet you will find something.)
BigBasti helped me in the comments to describe the high byte: Big numbers which need more than one byte to store the value have high bytes (most significant bytes) and low bytes (least significant bytes) - you need to know this to make sure you load the sequence of bytes in the correct order. - Thanks!
Ok - now we know the actual method. The exception occurs in the ButtonBase_OnClick method!
P8: Finding the exact position of the faulting code with ILSpy
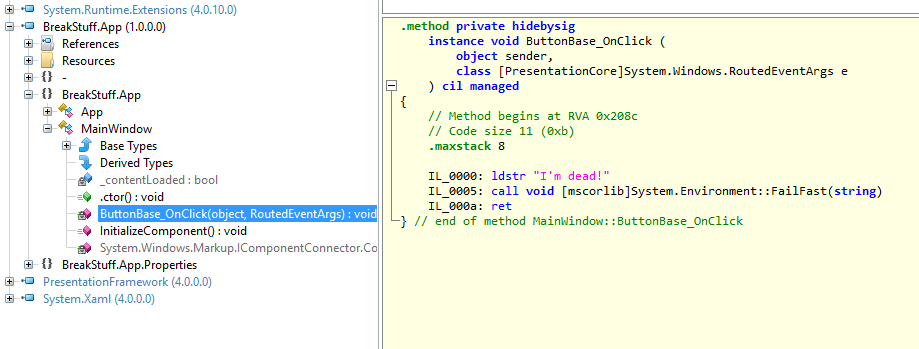
Now we need to look at the methods IL. You can use ILSpy or any other .NET decompiler (ildasm is not very comfortable, we only used it to get the method name). If you choosed ILSpy make sure you switch from the C# view to IL view and go to the faulting method:
// Method begins at RVA 0x208c
// Code size 11 (0xb)
.maxstack 8

IL_0000: ldstr "I'm dead!"
IL_0005: call void [mscorlib]System.Environment::FailFast(string)
IL_000a: ret
} // end of method MainWindow::ButtonBase_OnClick
As you might remember - P8 pointed to “a”, which is the IL_000a instruction.
Mission accomplished: Exception source found! Yay!
Big picture
I never thought I had to read the internal IL, but we had one weird case where no log files were generated and we used this trick to get to the source of the exception.
My breaking Sample Code on GitHub
Hope this helps!