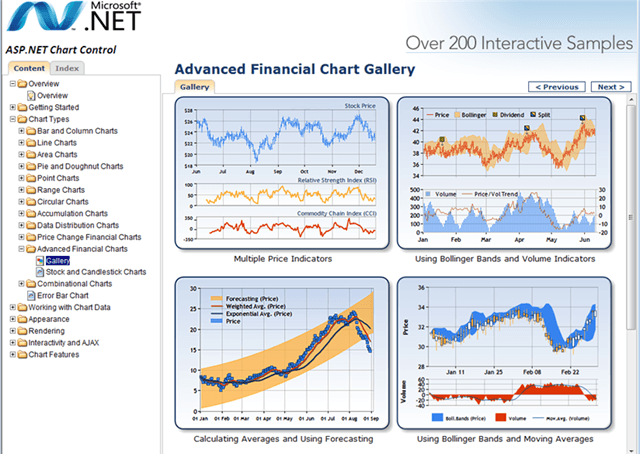
Microsoft hat heute ein neues kleines ASP.NET Feature veröffentlicht. Die Rede ist von den ASP.NET Chart Controls (welche zum Teil auf den Dundas Charts basieren).
Diese Controls schauen eigentlich ziemlich nett aus:
 <p>Das beste daran: Es funktioniert mit 2 Tricks auch recht gut mit ASP.NET MVC.</p> <p>Download Links für die ASP.NET Charts (alles kostenlos) :</p> <ul> <li>Download the free Microsoft Chart Controls</li> <li>Download the VS 2008 Tool Support for the Chart Controls</li> <li>Download the Microsoft Chart Controls Samples</li> <li>Download the Microsoft Chart Controls Documentation</li> </ul> <p>Web.Config editieren</p> <p>Unter "<system.web><pages><controls>" dieses hinzufügen:</p> <div class="wlWriterSmartContent" id="scid:812469c5-0cb0-4c63-8c15-c81123a09de7:9adfab10-0fa6-4131-92fe-1a259b53eecc" style="padding-right: 0px; display: inline; padding-left: 0px; float: none; padding-bottom: 0px; margin: 0px; padding-top: 0px"><pre name="code" class="c#"><add tagPrefix=”asp” namespace=”System.Web.UI.DataVisualization.Charting” assembly=”System.Web.DataVisualization, Version=3.5.0.0, Culture=neutral, PublicKeyToken=31bf3856ad364e35”/></pre></div>
Und unter den "<httpHandlers>" folgendes:
<add path="ChartImg.axd" verb="GET,HEAD" type="System.Web.UI.DataVisualization.Charting.ChartHttpHandler, System.Web.DataVisualization, Version=3.5.0.0, Culture=neutral, PublicKeyToken=31bf3856ad364e35" validate="false"/>
Meine Quelle: Combining ASP.NET MVC and ASP.NET Charting Controls
Chart Control hinzufügen:
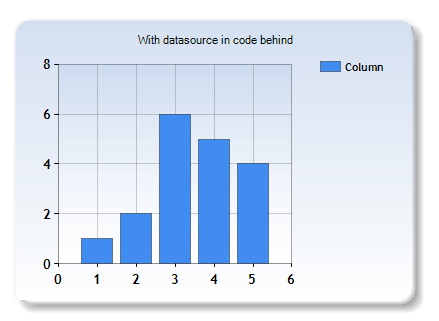
Variante A: ASP.NET Control + Code behind
Bei dieser Variante muss man ein paar Zeilen Code in der Code behind hinzufügen, allerdings sollte die gesamten Daten vom Controller kommen, sodass man dies noch als OK ansehen kann.
Ich habe dabei das "GettingStartet" Control aus den Samples genommen.
Index.aspx:
<asp:chart id="Chart1" runat="server" Height="296px" Width="412px" Palette="BrightPastel" imagetype="Png" BorderDashStyle="Solid" BackSecondaryColor="White" BackGradientStyle="TopBottom" BorderWidth="2" backcolor="#D3DFF0" BorderColor="26, 59, 105">
	<Titles>
		<asp:Title Text="With datasource in code behind" />
	</Titles>
	<legends>
		<asp:Legend IsTextAutoFit="False" Name="Default" BackColor="Transparent" Font="Trebuchet MS, 8.25pt, style=Bold"></asp:Legend>
	</legends>
	<borderskin skinstyle="Emboss"></borderskin>
	<series>
		<asp:Series Name="Column" BorderColor="180, 26, 59, 105">
		</asp:Series>
	</series>
	<chartareas>
		<asp:ChartArea Name="ChartArea1" BorderColor="64, 64, 64, 64" BorderDashStyle="Solid" BackSecondaryColor="White" BackColor="64, 165, 191, 228" ShadowColor="Transparent" BackGradientStyle="TopBottom">
			<area3dstyle Rotation="10" perspective="10" Inclination="15" IsRightAngleAxes="False" wallwidth="0" IsClustered="False"></area3dstyle>
			<axisy linecolor="64, 64, 64, 64">
				<labelstyle font="Trebuchet MS, 8.25pt, style=Bold" />
				<majorgrid linecolor="64, 64, 64, 64" />
			</axisy>
			<axisx linecolor="64, 64, 64, 64">
				<labelstyle font="Trebuchet MS, 8.25pt, style=Bold" />
				<majorgrid linecolor="64, 64, 64, 64" />
			</axisx>
		</asp:ChartArea>
	</chartareas>
</asp:chart>
Was das genau bedeuted kann in der Doku nachgelesen werden, wichtig ist, dass wir eine "Serie" namens "Column" haben - dies repräsentiert später unseren Balken auf dem Balkendiagram.
Index.aspx.cs:
    public partial class Index : ViewPage
    {
        protected void Page_Load(object sender, System.EventArgs e)
        {
            foreach (int value in (List<int>)this.ViewData["Chart"])
            {
                this.Chart1.Series["Column"].Points.Add(value);
            }
        }
    }
Ergebnis:
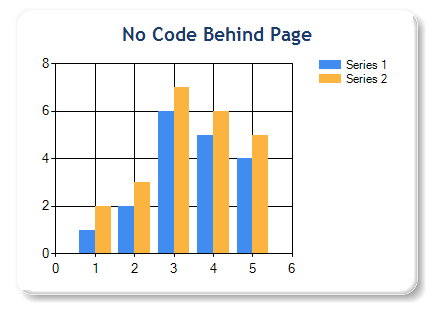
Variante B: Inline ASP.NET Control
Ohne Codebehind, direkt auf der Seite mit Inline Code:
        <p>
        <%
						System.Web.UI.DataVisualization.Charting.Chart Chart2 = new System.Web.UI.DataVisualization.Charting.Chart();
                        Chart2.Width = 412;
                        Chart2.Height = 296;
                        Chart2.RenderType = RenderType.ImageTag;

                        Chart2.Palette = ChartColorPalette.BrightPastel;
                        Title t = new Title("No Code Behind Page", Docking.Top, new System.Drawing.Font("Trebuchet MS", 14, System.Drawing.FontStyle.Bold), System.Drawing.Color.FromArgb(26, 59, 105));
                        Chart2.Titles.Add(t);
                        Chart2.ChartAreas.Add("Series 1");

						// create a couple of series
                        Chart2.Series.Add("Series 1");
                        Chart2.Series.Add("Series 2");

						// add points to series 1
                        foreach (int value in (List<int>)ViewData["Chart"])
                        {
                            Chart2.Series["Series 1"].Points.AddY(value);
                        }

                        // add points to series 2
                        foreach (int value in (List<int>)ViewData["Chart"])
                        {
                            Chart2.Series["Series 2"].Points.AddY(value + 1);
                        }

                        Chart2.BorderSkin.SkinStyle = BorderSkinStyle.Emboss;
                        Chart2.BorderColor = System.Drawing.Color.FromArgb(26, 59, 105);
                        Chart2.BorderlineDashStyle = ChartDashStyle.Solid;
                        Chart2.BorderWidth = 2;

                        Chart2.Legends.Add("Legend1");

						// Render chart control
                        Chart2.Page = this;
						HtmlTextWriter writer = new HtmlTextWriter(Page.Response.Output);
						Chart2.RenderControl(writer);

                     %>
        </p>
Ergebnis:
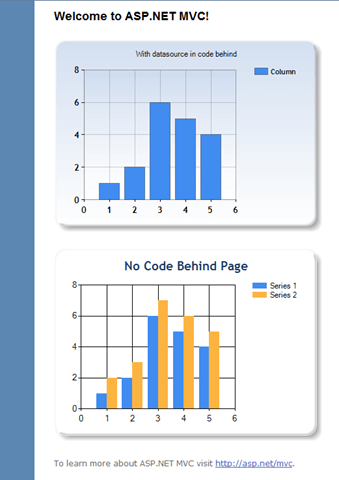
Beide Controls zusammen: